

Run a ping and MTR to the affected destination right now and record round-trip time and packet loss before doing anything else. Once you have that baseline, isolate the problem by hop, correlate the spike against device health and traffic patterns, then apply a targeted fix rather than a blanket one. If the evidence points outside your network, that is your signal to escalate to the ISP or the application owner.
TL;DR:
- Running baseline ping and MTR tests helps identify whether latency spikes occur at specific hops or are caused by external network factors.
- Isolating high-latency hops involves analyzing sustained increases over transient ones, focusing on jumps over 10 milliseconds as potential bottlenecks.
- Correlating device performance data and traffic patterns with latency spikes can reveal whether internal congestion or external routing issues are responsible.
- Fixes like adjusting buffer sizes, enabling AQM algorithms, or deploying CDNs should target the root cause identified during path analysis, not just capacity.
- Validating improvements requires re-testing with speed and stream tests and establishing ongoing monitoring to prevent regression.
Table of Contents
- The troubleshooting workflow from first check to fix
- Measurement tools and how to read their output
- How to read the path and find the bottleneck hop
- Correlating latency spikes with device and traffic data
- Device checks and configuration fixes that resolve latency
- Matching the fix to the actual cause
- Verifying the fix and setting up ongoing monitoring
- Using GrandSpeed to confirm fixes and track history
- What counts as good latency and what does not
- What engineers get wrong under pressure
- Confirming the fix holds with GrandSpeed
- Sources
- FAQ
The troubleshooting workflow from first check to fix
Latency incidents get resolved faster with a fixed sequence rather than ad hoc guessing. Work through these steps in order and stop as soon as you find the hop or device responsible.
- Basic local checks: confirm wired versus wireless, close bandwidth-heavy client processes, and inspect cables and ports before touching the network.
- Quick measurements: run ping for round-trip time and loss, then run MTR for a continuous per-hop profile.
- Isolate the segment: find the first hop where latency jumps and stays elevated, and map that hop to LAN, ISP, peering, or the destination server.
- Correlate metrics: check device CPU, interface errors, and NetFlow or top-talker data against the timestamps of the spike.
- Apply a targeted fix: use QoS, AQM, an MTU correction, or a CDN depending on what step 3 and step 4 revealed, then retest.
- Document and verify: confirm the fix held, then set up monitoring so the same problem surfaces automatically next time.
This stepwise process of basic checks, measurement, path analysis, and device correlation is the standard approach for isolating latency from packet loss and other performance faults.
Measurement tools and how to read their output
Your tools are only as good as your interpretation of them. A few habits separate a reliable diagnosis from a guess.
- Ping gives you min, avg, max, and mdev. A high mdev relative to avg signals jitter, while a rising min across repeated runs signals sustained congestion rather than a transient blip.
- MTR should replace traceroute for anything beyond a one-off check, since it samples each hop continuously and shows per-hop latency and loss over time instead of a single snapshot. A hosted option like Pingfloat's traceroute tool is useful when you need a quick path check from outside your own network.
- Packet capture at the edge, ingress, and egress confirms whether retransmits and TCP behavior match what MTR suggests, which matters when the delay looks server-side rather than network-side.
- IP SLA and UDP jitter probes give you directional, one-way statistics, but they only mean something once source and target share an NTP time sync, which is essential for VoIP and video troubleshooting where one direction is often worse than the other.
Watch for false positives: many routers rate-limit ICMP replies, so a hop that looks slow or unresponsive in ping or MTR may simply be deprioritizing your probe traffic, not actually delaying your real packets.
How to read the path and find the bottleneck hop
The goal of per-hop analysis is finding the first hop where latency increases and never comes back down. A single spike that disappears on the next hop is noise. A spike that persists through every subsequent hop is your bottleneck.
- Watch for the first sustained increase, not the first increase. Transient jumps at one hop that vanish downstream are almost always processing artifacts.
- Use jump-size rules of thumb: +1 to 5ms is normal router processing, +10 to 30ms often reflects city-to-city transit, +50 to 100ms typically means a cross-region hop, and +100ms or more usually points to an intercontinental link, according to common diagnostic guidance on interpreting hop increases.
- Ignore hops that show as unresponsive or high-latency in isolation if the hops before and after them look normal, since that pattern usually means ICMP deprioritization rather than a real problem.
- Cross-reference hostnames, geolocation, and ASN data on the jump hop to determine whether you are looking at your ISP's network, a peering point, or the destination's own infrastructure.
Correlating latency spikes with device and traffic data
A clean per-hop trace does not always tell you why the delay happened. Correlating the timing of the spike with what your devices were doing at that exact moment usually closes the gap.
- Overlay the spike's timestamp against router or switch CPU, memory, and interface error counters to see if the device itself was struggling.
- Pull NetFlow or sFlow data for that window to identify top talkers and flag whether one application or host was flooding the link.
- Check for scheduled jobs, backup windows, or replication tasks that line up with the spike, since recurring latency at the same time each day is rarely coincidental.
- When device metrics come back clean and traffic looks normal, shift your suspicion outward toward ISP routing or the remote application, since baseline comparison against CPU, memory, and interface metrics is the standard way to separate internal from external causes.
Device checks and configuration fixes that resolve latency
Plenty of latency complaints trace back to a misconfigured interface rather than a congested path. Work through the device before blaming the network.
- Check interface error and discard counters, and verify duplex and MTU settings match on both ends of every link.
- Inspect CPU and QFP utilization to see whether delay is happening in the control plane or the data plane, since the fix differs for each.
- Look for bufferbloat, which shows up as latency that climbs sharply under load, and enable an AQM algorithm such as CoDel or PIE, or ECN where supported, to control it directly rather than relying on oversized buffers.
- Verify QoS classification actually tags voice, video, and signaling traffic correctly, since a misconfigured class map will silently treat real-time traffic the same as bulk downloads.
Pro Tip: A duplex mismatch or a single flapping interface can produce latency symptoms that look identical to congestion, so rule out the cheap causes before you touch queuing or QoS policy.
Matching the fix to the actual cause
The four components of latency, propagation, transmission, processing, and queuing delay, each call for a different fix, and picking the wrong one wastes time and money.
- Add bandwidth only when you have confirmed a sustained capacity limit, not a queuing problem, since more bandwidth does nothing for delay caused by buffering.
- Use an edge or CDN strategy when the delay is propagation-dominated, since moving content closer to the user beats raising bandwidth for distance-driven latency.
- Enable AQM algorithms like CoDel or PIE instead of relying on large buffers, since these algorithms are designed to manage queuing delay directly and target a low delay bound rather than letting queues grow until they drop packets.
- Apply QoS to prioritize signaling and real-time flows such as VoIP and video conferencing rather than throttling everything indiscriminately.
- On the application side, enable connection reuse, move to HTTP/3 or QUIC where supported, and cut unnecessary DNS lookups or payload size when the delay is happening above the network layer.
Verifying the fix and setting up ongoing monitoring
A fix that is not re-tested is a guess with extra steps.
- Re-run ping and MTR against the same destination and confirm the min, avg, max, and mdev values have actually improved.
- Stand up synthetic probes with alert thresholds on RTT, jitter, and loss so the next regression gets caught automatically.
- Where directional visibility matters, such as for VoIP or video, configure IP SLA one-way measurements after confirming NTP sync between source and target.
- Write down what changed, why, and what the before-and-after numbers were, so the next engineer does not repeat the investigation from scratch.
Using GrandSpeed to confirm fixes and track history
A quick end-to-end check is often the fastest way to know whether a fix actually worked before you commit to deeper packet-level diagnostics.
- GrandSpeed measures latency, jitter, packet loss, bufferbloat, and DNS resolution time in a single test, which covers most of what a first-pass check needs.
- Test history functionality lets users compare a result against a prior baseline, which is useful for confirming a regression actually happened rather than assuming it.
- A practical sequence is a quick GrandSpeed test, then MTR to isolate the hop, then a packet capture if the root cause still is not clear.
What counts as good latency and what does not
Latency is the round-trip time it takes a packet to travel from source to destination and back, usually measured in milliseconds. Context matters more than a single number: a broadband connection to a nearby server typically runs 10 to 50 milliseconds, while a transcontinental route commonly lands in the 100 to 300 millisecond range for the same source.
Anything above 100 milliseconds tends to be noticeable to a user, and anything past 300 milliseconds is generally considered poor for interactive use, according to the same latency explainer. Where your traffic sits in that range depends heavily on physical distance, since propagation delay is fixed by the speed of light in fiber and cannot be optimized away with more bandwidth.

This is why moving content physically closer to the user through edge computing or a CDN often beats a bandwidth upgrade when the dominant delay component is propagation rather than queuing. Gaming and VoIP traffic are the least tolerant of latency and jitter together, while bulk file transfer barely notices either. Knowing which category your affected application falls into should shape how aggressively you chase every extra millisecond versus accepting a stable, if unremarkable, RTT. Livestreaming and conferencing workloads sit closer to the sensitive end, and the typical latency ranges for streaming are worth checking before assuming a fix is needed at all.
What engineers get wrong under pressure
The most common mistake is buying bandwidth before isolating the bottleneck. Triage in order: LAN and device first, then ISP and peering, and escalate outward only when the evidence points there. Reducing queuing delay usually matters more than raw throughput for interactive traffic.
— Peter D
Confirming the fix holds with GrandSpeed
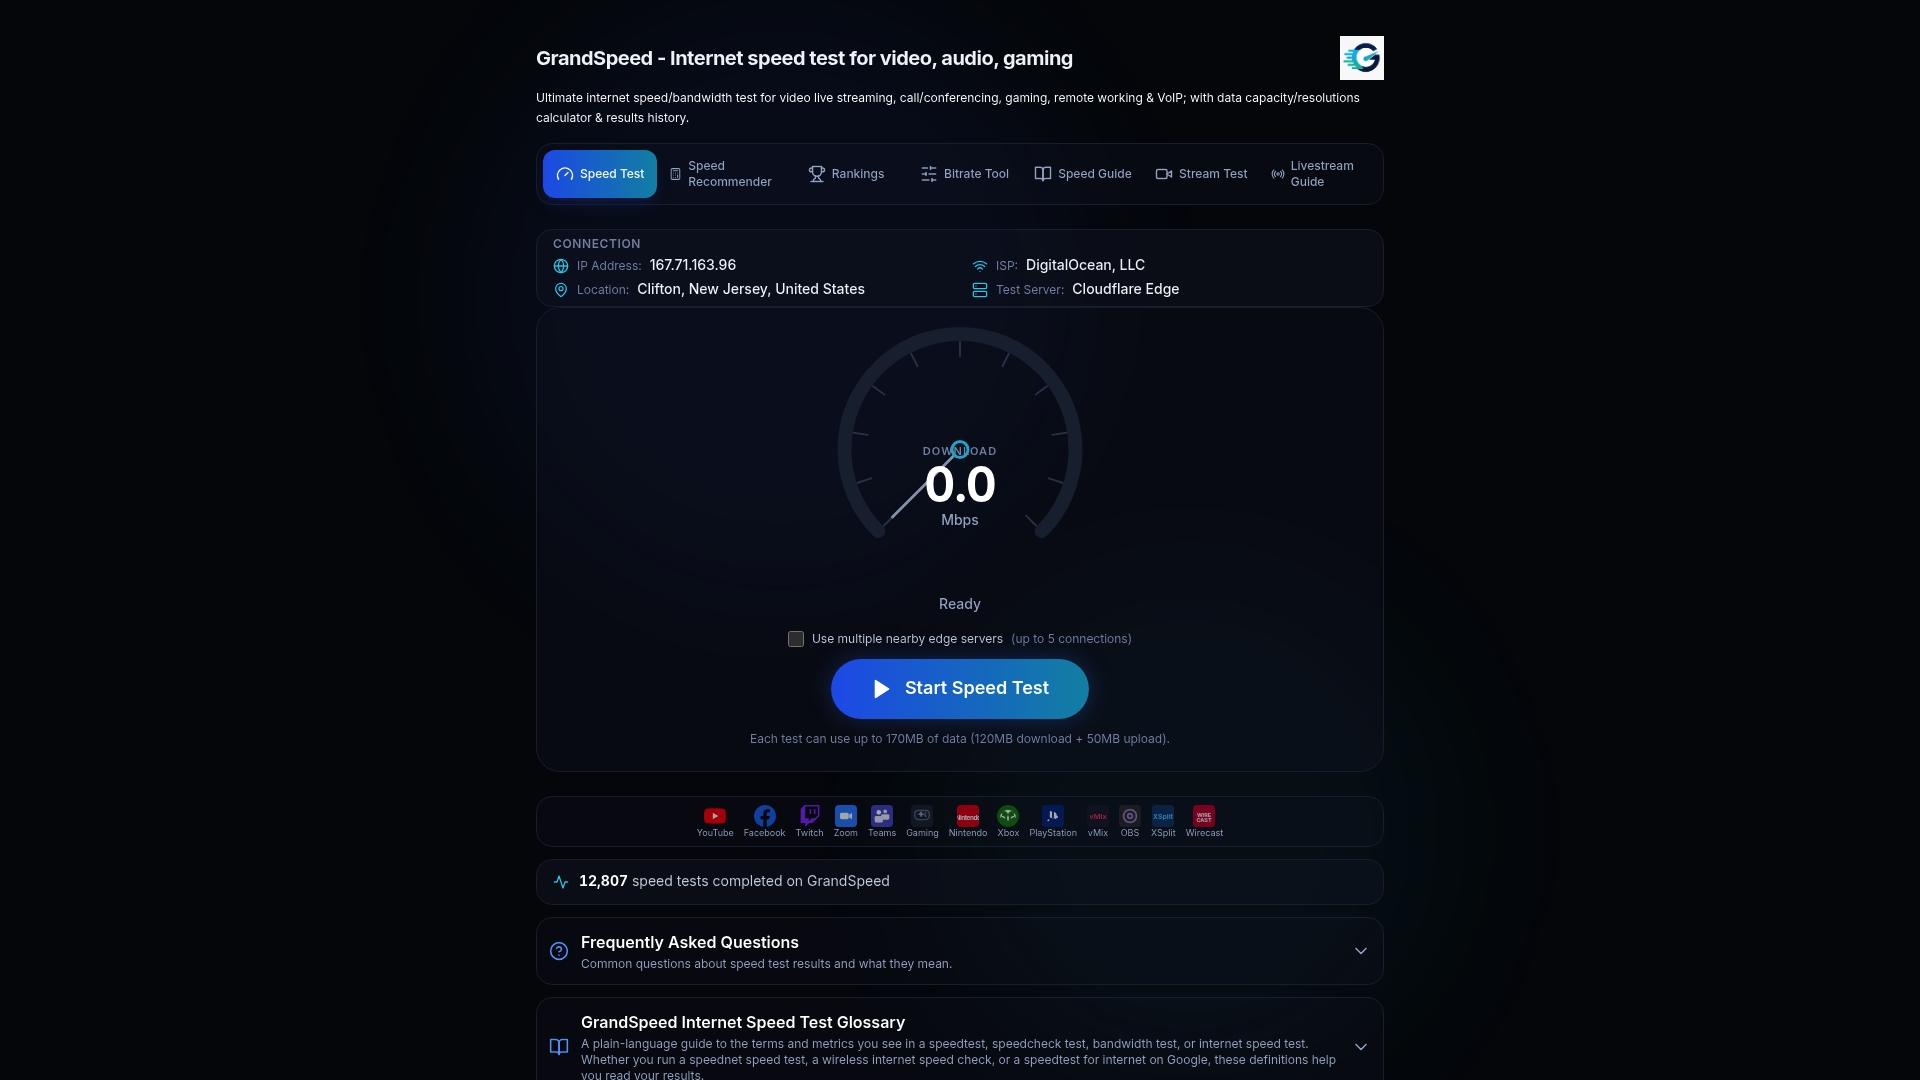
Once you have applied a fix, whether it is enabling AQM, correcting a duplex mismatch, or repointing traffic through a CDN, you still need a fast way to confirm it actually worked without spinning up a full packet capture every time.
- Run the speed test for a quick end-to-end read on latency, jitter, packet loss, and bufferbloat right after a change.
- Use the stream test when the affected traffic is video or conferencing, since it reports the maximum resolution your current connection actually supports.
- Check test history to see whether the numbers you are looking at now are genuinely better than the baseline recorded before the fix.
If the results still point to a capacity ceiling rather than a queuing or config issue, the speed recommender can help map your test results to a plan that actually fits the workload.
Sources
- What is Latency? | Network Latency Explained | Azion
- Troubleshooting network latency issues
- IETF AQM/PIE draft (RFC archive)
FAQ
How can I fix latency issues?
Start by measuring round-trip time and loss with ping, then run MTR to find the first hop where latency jumps and stays elevated. Once you have isolated the segment, apply a targeted fix such as AQM for bufferbloat, QoS for real-time traffic, or a CDN for propagation-heavy delay, then retest to confirm the change worked.
Why is my latency bad all of a sudden?
A sudden increase usually points to a new condition rather than a chronic one: a congested link, a misconfigured interface, a routing change at your ISP, or a scheduled job like a backup consuming bandwidth. Correlating the exact timestamp of the spike against device CPU, interface counters, and top-talker traffic data usually narrows it down quickly.
How do I troubleshoot latency if the issue is intermittent?
Intermittent latency needs continuous sampling rather than a single ping, since a one-off snapshot will miss the spike entirely. Run MTR or a synthetic probe over an extended window and log the results so you can match spikes to specific times, traffic patterns, or device events.
What is a latency problem?
A latency problem is a delay in round-trip packet time that is noticeably higher than the expected range for the distance involved, typically above 100 milliseconds for noticeable impact and 300 milliseconds for poor performance. It stems from one or more of four components: propagation, transmission, processing, or queuing delay, with queuing being the most common target for a fix.