

Run a quick browser bufferbloat test or start a live ping while running a speed test. If latency jumps under load, you have bufferbloat. That single check settles the question for most home networks. When the spike is bad or you need to prove a fix worked, move to Flent or iperf for repeatable numbers, and judge the result by how many milliseconds latency climbed, not by your download speed.
TL;DR:
- Web-based bufferbloat tests are quick but can be inconsistent; running multiple times and at different times of day provides more reliable results.
- Continuous ping tests during speed tests reveal sustained latency spikes during upload or download saturation, indicating bufferbloat in real time.
- Dedicated tools like Flent or iperf3 offer repeatable benchmarking data necessary for fine-tuning router queue management and verifying fixes.
- A latency increase over 30 milliseconds during load phases signals moderate bufferbloat, while over 150 milliseconds severely impacts call quality and gaming.
- More bandwidth rarely solves bufferbloat; fixing it typically requires adjusting queue management settings on your router.
Table of Contents
- What Are Web-Based Bufferbloat Test Methods?
- How Do I Test Bufferbloat With a Continuous Ping?
- When Should I Use Flent, iperf, or Netperf?
- What Latency Increase Counts as Bufferbloat?
- How Do I Run a Reliable Before-and-After Bufferbloat Test?
- How Does GrandSpeed Fit Into a Bufferbloat Testing Routine?
- Which Bufferbloat Test Should You Actually Run?
- Test Your Connection With GrandSpeed's Browser Diagnostics
- Where to Verify These Bufferbloat Testing Methods
- Sources
- FAQ
What Are Web-Based Bufferbloat Test Methods?
A browser bufferbloat test runs your connection through four distinct phases. First it measures idle latency as a baseline, then it saturates your download, then your upload, and some tools finish with a bidirectional phase that loads both directions at once. The LibreQoS test is built around exactly this structure, and it's the model most modern web testers follow.
The output usually includes idle latency, the loaded latency increase in milliseconds, jitter, packet loss, and a letter grade summarizing the whole run. That grade is the headline number, but the raw millisecond delta between idle and loaded latency is what actually tells you whether your router's queue management is doing its job.
For most home users, a web test is enough. It catches the obvious cases: a router with no active queue management, a modem buffering way more than it should, a Wi-Fi mesh system quietly adding delay. Where web tests fall short is consistency. Browser tests run through a CDN, last only a few seconds per phase, and can be skewed by background apps stealing bandwidth mid-test.
Before you run one, a short checklist helps:
- Close streaming apps, cloud backups, and game downloads running in the background.
- Connect the test device directly if possible, or note that you're on Wi-Fi.
- Run it two or three times, not once, since a single result can be a fluke.
- Note the time of day. Evening congestion on your ISP's network can look like bufferbloat but isn't.
If your grade comes back solid every time, you're probably fine. If it's inconsistent or bad, that's your cue to dig deeper.
How Do I Test Bufferbloat With a Continuous Ping?
This is the fastest way to see bufferbloat happen in real time, and it needs nothing but a terminal and a speed test tab.
- Open a terminal and start a continuous ping to a stable host:
ping 1.1.1.1on Mac or Linux,ping -t 1.1.1.1on Windows. Cloudflare's1.1.1.1and Google's8.8.8.8both work well because they respond fast and rarely rate-limit. - Let it run for 15 to 20 seconds untouched so you can see your true idle latency. Write that number down.
- In a browser tab, launch a full speed test and watch the ping window while the download phase runs.
- Watch the same window during the upload phase. Upload saturation often causes worse spikes than download, because most home routers have a smaller upload buffer to overflow.
- Compare the numbers. If idle ping sat around low milliseconds and jumped substantially during upload, that increase is your bufferbloat signature.
A few interpretation notes matter here. A single spike that lasts one ping cycle and vanishes is usually noise, maybe a background app grabbing bandwidth for a second. A sustained climb that holds for the whole saturation phase is the real signal. If only upload spikes and download stays clean, the bottleneck sits in your router's or modem's upload buffer specifically, which points you toward upload-side queue management first.
When Should I Use Flent, iperf, or Netperf?
Browser tests and the ping trick are enough to spot a problem. They're not enough to prove you fixed it, and that's where dedicated benchmarking tools earn their place.
Flent is purpose-built for this. Its RRUL test (Realtime Response Under Load) saturates upload and download simultaneously while tracking latency across multiple streams, and it's designed for repeatable benchmarking up to 40GigE. It logs everything and produces charts you can compare run to run, which matters enormously if you're tuning smart queue management (SQM) settings and need to see whether a change actually helped.
iperf/iperf3 and netperf work at a lower level. Both generate controlled synthetic traffic streams for measuring throughput and latency, and Flent actually uses them under the hood for some of its test types. Running iperf3 with multiple parallel streams (iperf3 -c server -P 8) gives you a closer approximation of real-world bidirectional load than a single-stream test ever will.
A few setup notes that matter more than people expect:
- Pick a test endpoint that can actually sustain the traffic you're throwing at it. A cheap VPS with 100Mbps of uplink will bottleneck before your gigabit connection does, and you'll misdiagnose your own router as the problem.
- Run each test for a sufficient duration since shorter runs may miss steady-state buffering behavior.
- Run identical parameters multiple times before trusting a single result. Network conditions vary run to run even on a stable line.
- Confirm the test truly saturates your link. If your speed test shows you're only hitting 60% of rated bandwidth, you're not stressing the queue enough to see real bufferbloat.
Reach for this tier when a browser test flags a problem you can't resolve with one setting change, when you're actively tuning SQM and need before/after proof, or when you're troubleshooting on someone else's network and need a client wants hard numbers instead of a letter grade.
What Latency Increase Counts as Bufferbloat?
The number that matters is the delta: loaded latency minus idle latency. Take the worst of your download, upload, and bidirectional phases, since that's the direction actually causing your problem.
Pro Tip: Don't average your ping samples during the loaded phase. Take the peak. A router that spikes to 300ms for two seconds during a big upload will ruin a video call even if the average looks fine.
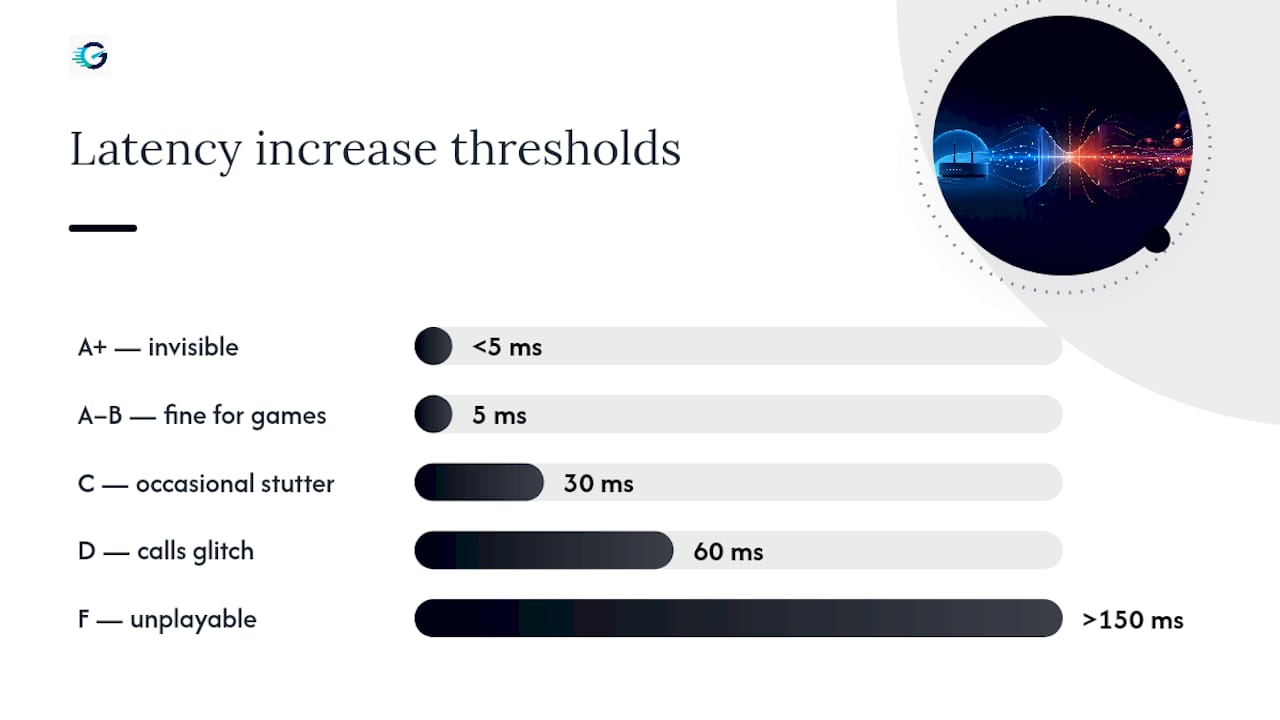
Grading rubrics used by common bufferbloat testers translate that millisecond delta into letter grades, and the pattern generally runs something like this:
| Latency increase | Grade | What it means in practice |
|---|---|---|
| Under 5ms | A+ | Essentially invisible, even under heavy load |
| 5 milliseconds | A to B | Fine for gaming and calls, rarely noticeable |
| 30 milliseconds | C | Occasional stutter on calls, minor game lag |
| 60 milliseconds | D | Video calls glitch, competitive gaming suffers |
| Over 150 milliseconds | F | Calls drop words, games become unplayable |
Jitter, the variation between consecutive ping times, compounds the problem. A connection with 150ms average loaded latency but low jitter is annoying but predictable. The same 150ms with wild swings between 50ms and 400ms is far worse for VoIP and gaming, because your app's buffer can't adapt fast enough. Packet loss on top of either one is usually the final straw. It's what turns a laggy call into a call that keeps dropping words entirely.
If a spike only shows up in one direction, treat that as useful information rather than a red flag on your whole connection. And never trust a single test. Run it again after making any change.
How Do I Run a Reliable Before-and-After Bufferbloat Test?
Bad testing habits produce false positives more often than actual network problems do. A few rules fix most of that.
- Skip metered or mobile connections for full test runs. Heavy diagnostic sessions can transfer 1 to 4GB of data, which adds up fast on a phone plan.
- Use Ethernet whenever you can. Wi-Fi adds its own latency variance from interference and other clients, which muddies whether the router or the wireless link is the actual bottleneck.
- If you must test over Wi-Fi, write down your location, how many other devices were active, and what band you were on.
- Change exactly one setting at a time. If you enable SQM and adjust your MTU in the same session, you won't know which one fixed anything.
- Repeat the identical test after each change. A baseline test, then a change, then the same test again is the only way to prove a fix actually worked rather than assume it did.
Keeping a simple log, time of day, connection type, number of runs, saves you from chasing your own tail later. Some tools offer a test history feature that does this automatically if you'd rather not track it by hand.
How Does GrandSpeed Fit Into a Bufferbloat Testing Routine?
A browser test can run the same baseline, download, and upload phases described above, reporting jitter, packet loss, and a bufferbloat score alongside speed numbers. Saving every run to an account helps provide the before/after comparison this kind of testing depends on without keeping a separate spreadsheet.
- Use it as your first check and for repeat monitoring over weeks or months.
- Escalate to Flent or iperf when a persistent problem needs deeper, protocol-level diagnostics or you're tuning SQM settings that require finer control.
- A streaming-resolution guidance feature can tell you the maximum broadcast quality your measured connection actually supports, useful context once bufferbloat is under control.
For anyone livestreaming or running video calls regularly, pairing a bufferbloat check with the livestreaming guide helps connect the test numbers to what you'll actually see on screen.
Which Bufferbloat Test Should You Actually Run?
If you're testing your home network for the first time, run a web test and the ping-plus-speediest combo. That's genuinely enough for the vast majority of setups, and it takes five minutes.
If you're tuning SQM, chasing an intermittent problem, or need to prove a change worked, learn Flent. It's not hard to install, and the RRUL charts tell you things a browser grade never will.
One thing worth repeating: more bandwidth almost never fixes bufferbloat. It's a queue management problem, and the fix usually lives in your router's SQM settings, not your ISP plan.
— Peter D
Test Your Connection With GrandSpeed's Browser Diagnostics
Some browser tests offer a fast path from "something feels off during calls" to an actual number you can act on. Instead of installing Flent or wrestling with iperf syntax before you even know if you have a problem, you can run one browser test that checks bufferbloat, jitter, and packet loss together and saves the result so you can compare it after any router change.
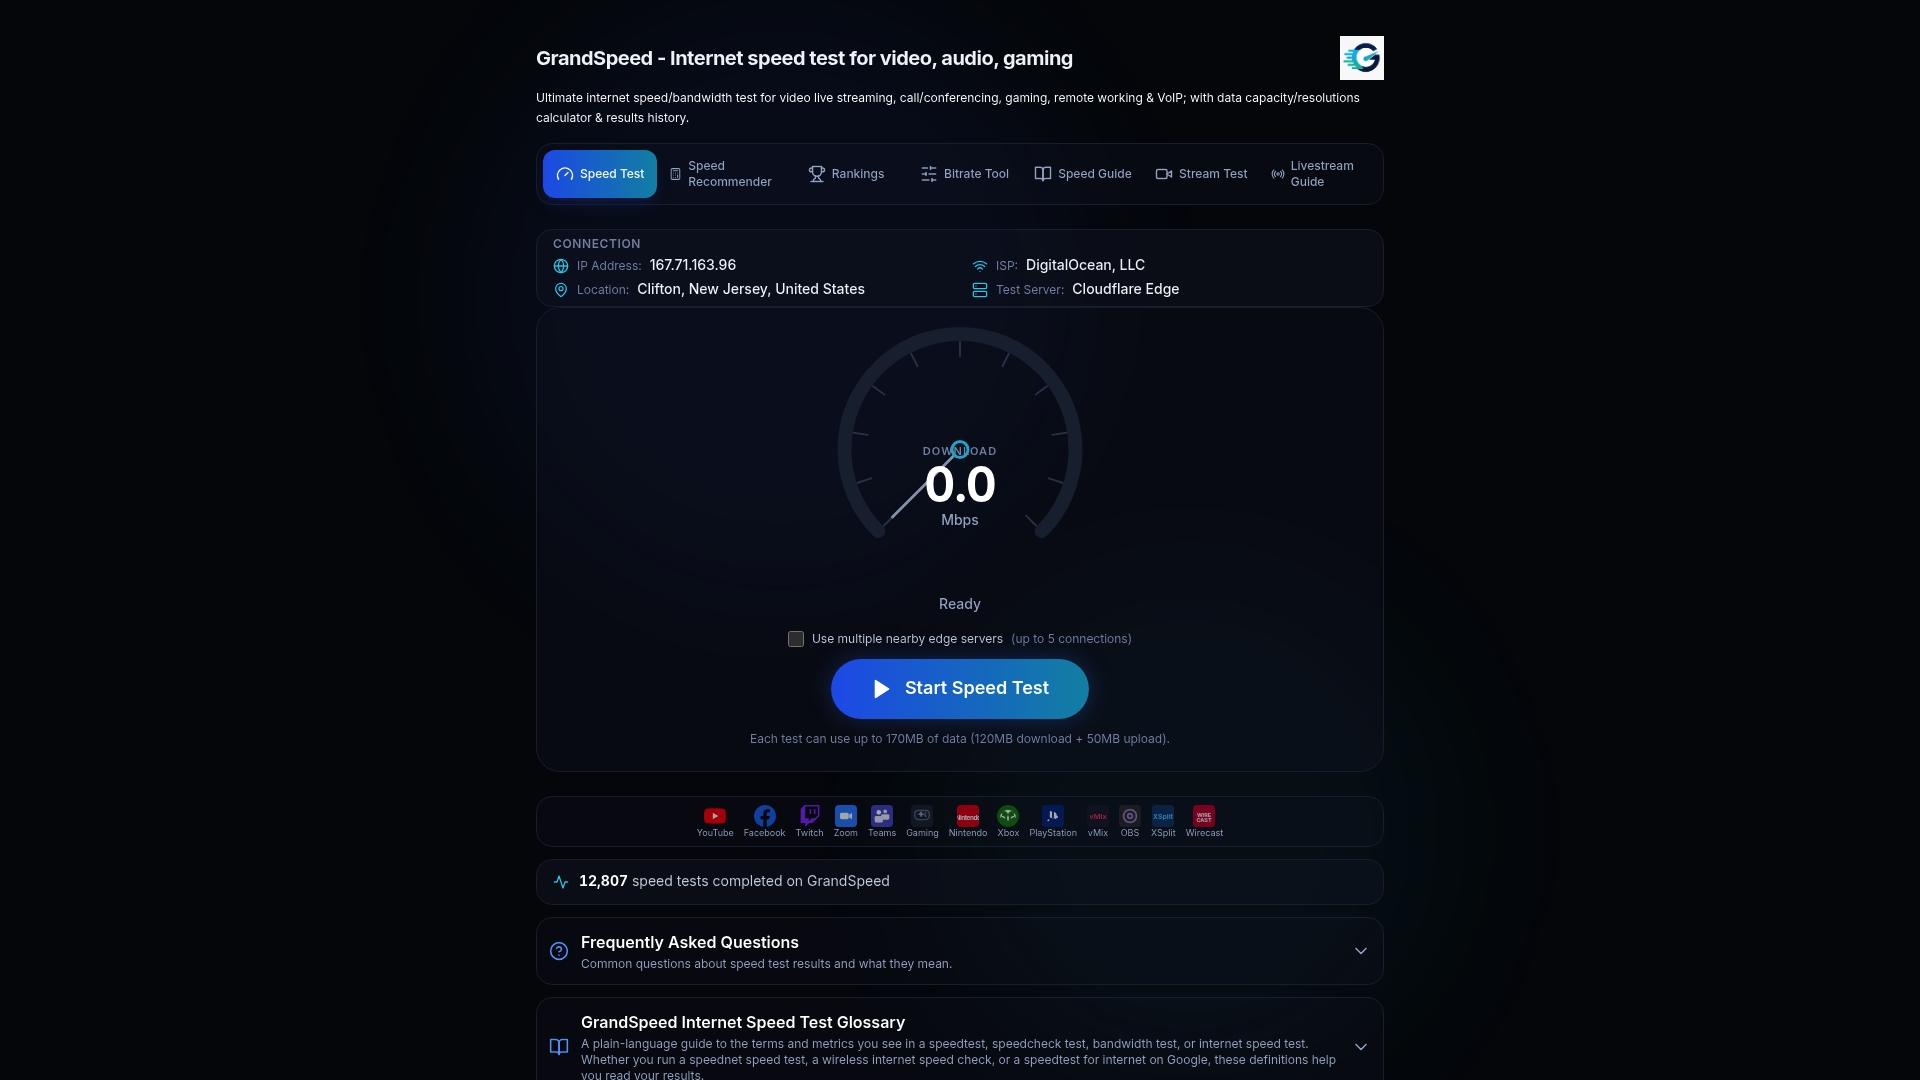
That saved history is the part most quick tests skip entirely. Run a baseline today, enable SQM on your router tonight, then run the exact same test tomorrow and see the millisecond delta close for yourself. GrandSpeed also tells you the maximum streaming resolution your measured connection supports, so if you're troubleshooting lag on a livestream setup, you get both the diagnosis and the practical ceiling in one place. Head to the stream test at grandspeed.net and run your first check now.
Where to Verify These Bufferbloat Testing Methods
- The Flent project site for RRUL documentation, iperf/netperf integration, and download links.
- LibreQoS's browser test for a multi-phase, household-style bufferbloat check.
FAQ
What Is the Best Tool to Test for Bufferbloat?
For a quick check, a browser-based bufferbloat test like GrandSpeed's is enough. For repeatable, protocol-level benchmarking, especially when tuning SQM, Flent's RRUL test is the standard recommended by the Bufferbloat.net project.
How Can I Test for Bufferbloat Myself?
Start a continuous ping to a stable host like 1.1.1.1, then run a full speed test while watching the ping window. A sustained jump of dozens or hundreds of milliseconds during the upload or download phase confirms bufferbloat.
Is 50 ms of Jitter Bad?
Yes. Jitter that high causes noticeable stutter on video calls and lag spikes in games, since most VoIP and gaming apps can't smooth out swings that large in real time.
How Can I Test if My Internet Is Being Throttled?
Throttling and bufferbloat look different: throttling caps your raw speed consistently, while bufferbloat leaves speed intact but latency spikes under load. Running a speed test at different times of day alongside a bufferbloat check helps separate the two, since a throttled connection shows low speeds even with an empty queue.